步驟 1
Describe your explainer infographic
Provide the details for the first explainer infographic.
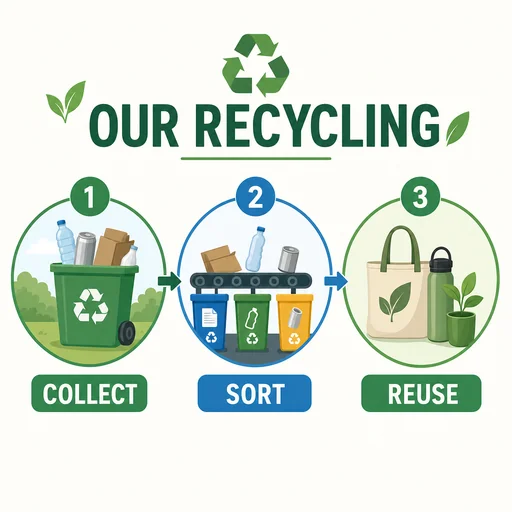

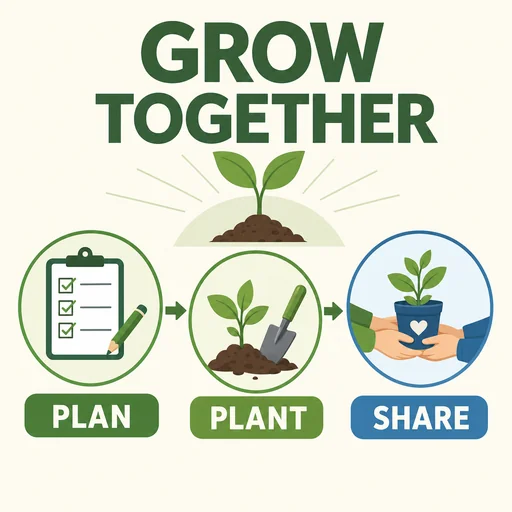

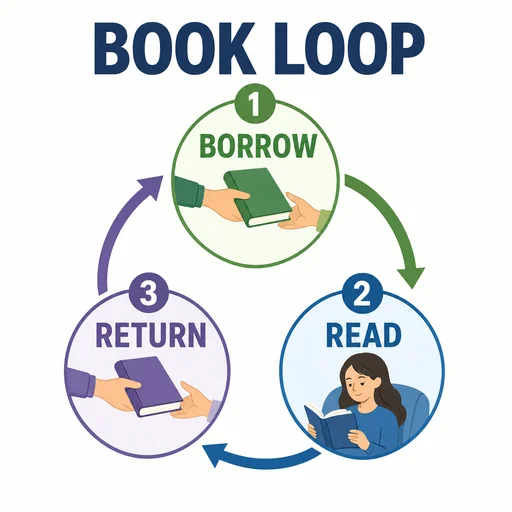
Turn a complex idea into a clear visual story with organized sections, simple illustrations, and labels designed for easy scanning.
Describe the topic, audience, key facts, and structure you want the explainer infographic to communicate.
Ask for one central idea, logical sections, restrained colors, simple illustrations, and labels that support scanning.
Review whether the visual hierarchy keeps supplied facts easy to follow without clutter or invented data.
Clear visual explanations
Organize your facts into a focused infographic that helps people follow the main idea, supporting details, and visual hierarchy.
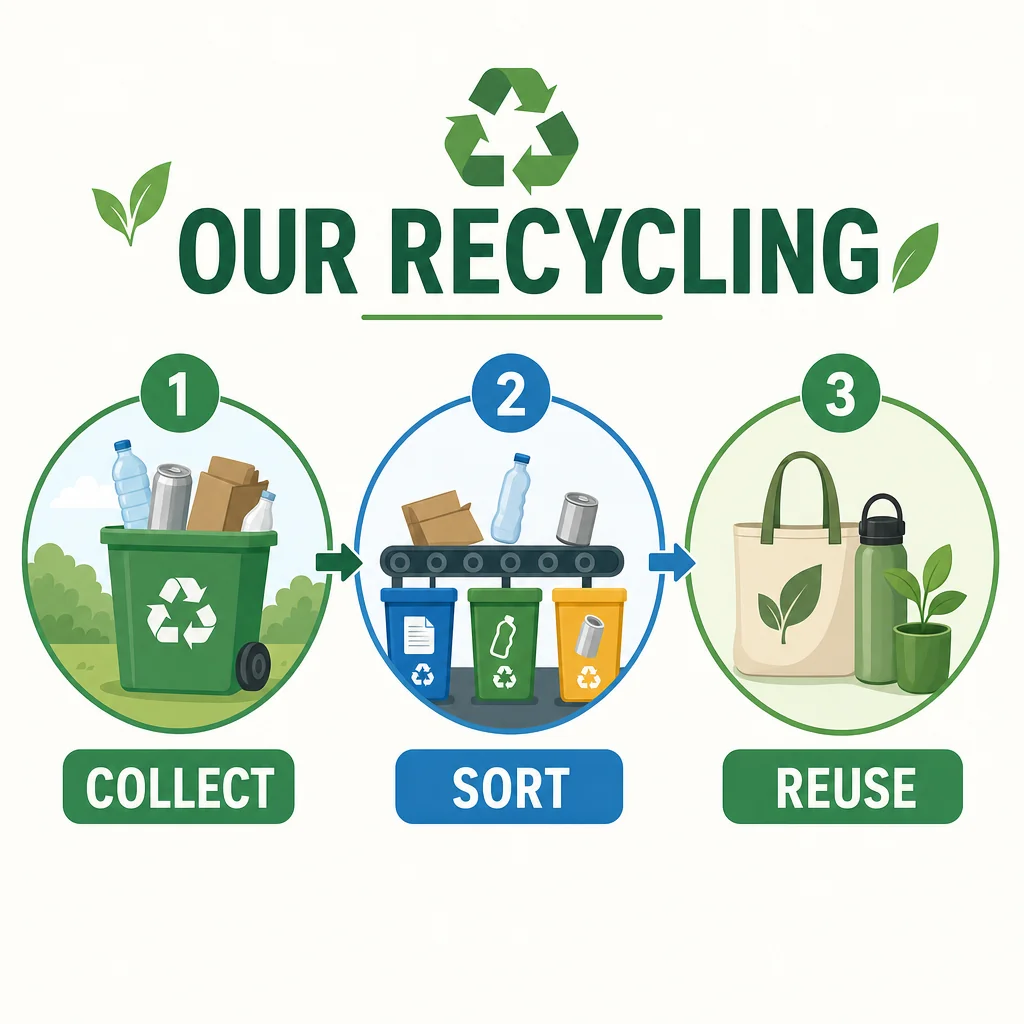
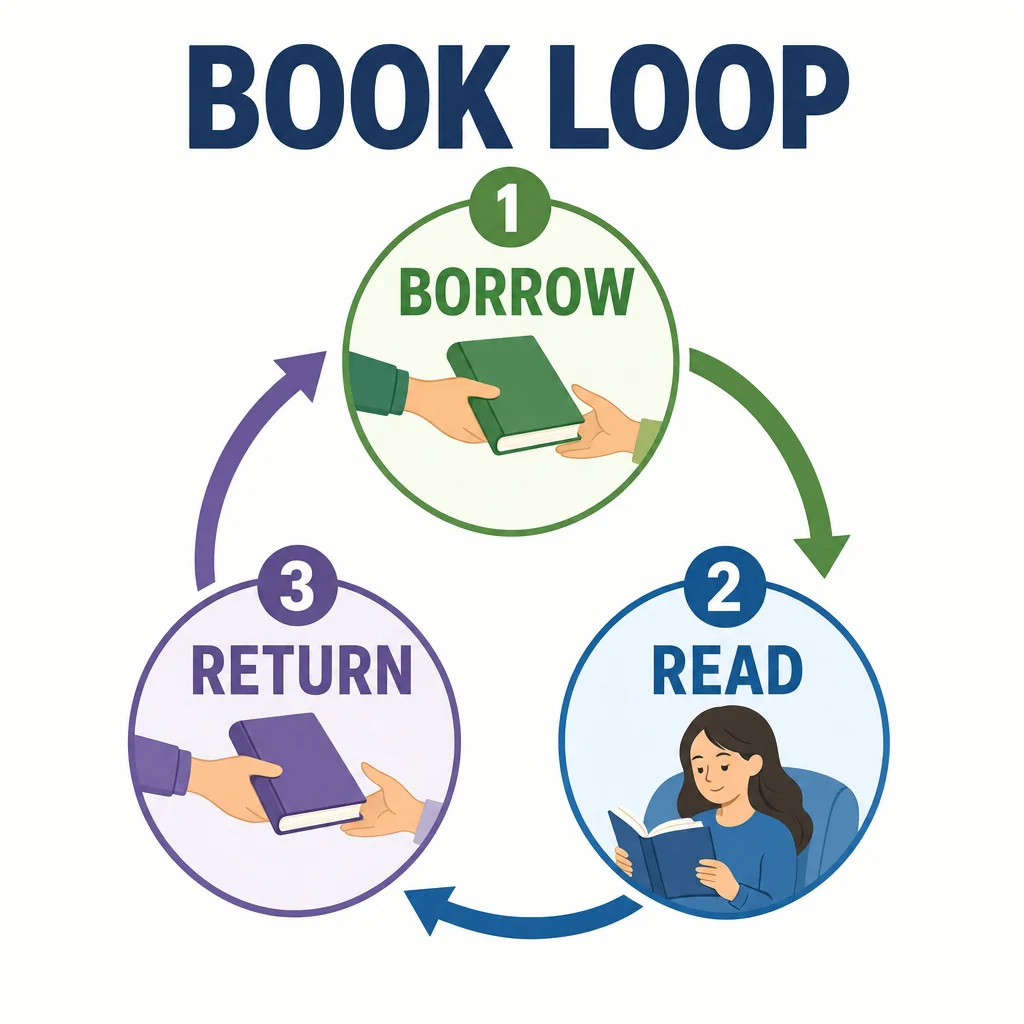

Create a first explainer infographic, refine that same image, and review the final result.
步驟 1
Provide the details for the first explainer infographic.
步驟 2
Use the actual first result with this follow-up.
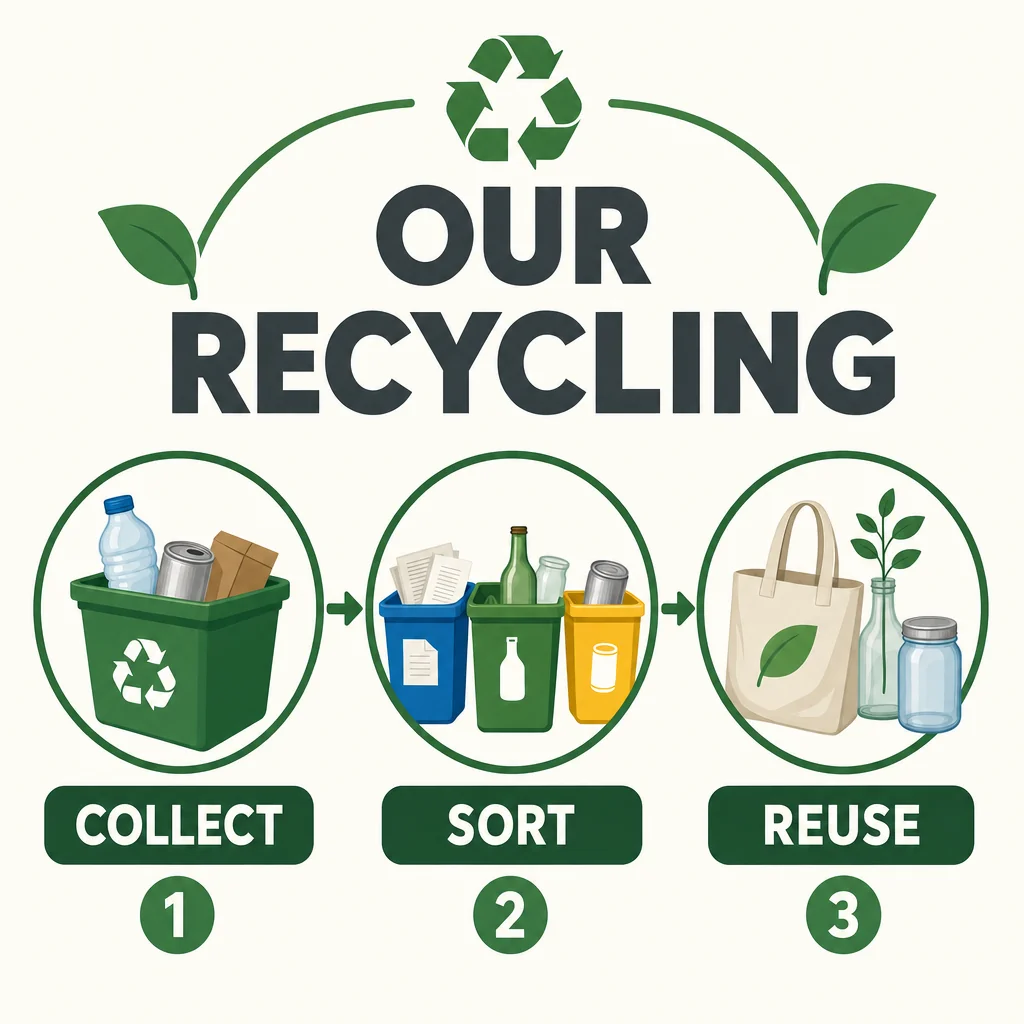
步驟 3
Check the OUR RECYCLING, COLLECT, SORT, REUSE and supplied stage relationships against your request.